Social network simulator
14 October 2015
As part of the data-driven dance performance [data]storm by readysaltedcode I developed a social network simulator to demonstrate network growth and message propagation. In this article I delve a bit deeper into these simulations.
(The idea for making a social network simulator grew out of my failure to find suitable data to visualise. It just goes to show that constraints breed creativity!)
Network growth
The first of the simulations shows network growth. Each node in the network represents a user who has the following characteristics:
- friendliness (how often they're likely to make friends with another user)
- chattiness (how often they send out messages)
- category (the subject area they're most interested in)
Friendliness indicates how likely they are to make friends with another user whilst chattiness indicates how likely they are to be noticed by other users. The category indicates which subject (in our case, this is just represented by a number between 1 and 10) the user is most interested in. A user is most likely to connect with users who share the same interests.
At random time intervals two things occur:
- new users are added to the network
- depending on the above characteristics, users become friends with each other
All the rules stay the same throughout the simulation.
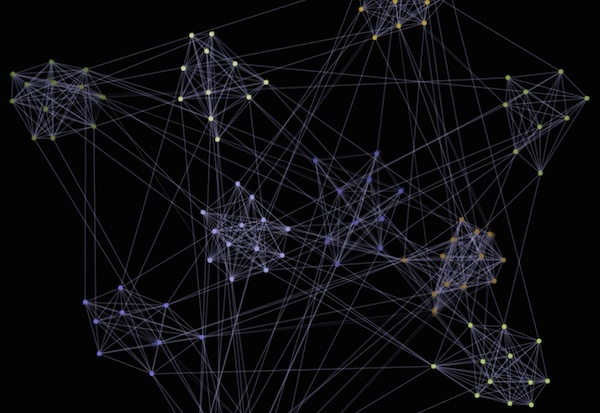
When we run it, we see the network start with just a few scattered nodes. It then starts to take shape, with users tending to congregate in groups with the same interest. As the simulation continues, more and more connections are added, and eventually we get a very dense connected network.
Run the network simulation in your browser (modern browsers only).
Message propagation
The second simulation shows how messages spread through the network. Every now and then, a user will create a message. A user sending out a message is represented by the user becoming a coloured dot. The user's friends will be able to see the message, and depending on how interesting the message is, the friend may choose to repeat the message. (In Twitter terms, this is a retweet.)
What I was hoping to observe was how network density affects propagation and the likelihood of messages going viral.
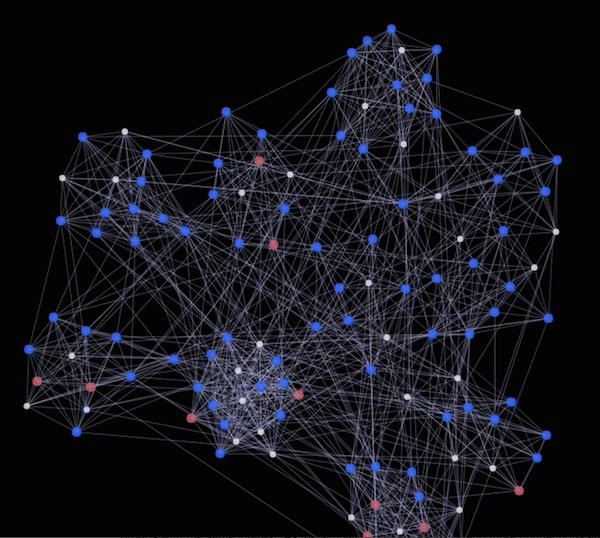
When the simulation runs we see the network slowly grow and every now and then a user messages. Occasionally a friend will repeat the message. As the network density grows, we tend to see messages getting repeated within the same niche (i.e. group of users who share the same category) but before long, the messages do indeed go viral and spread throughout the whole network.
Run the messaging simulation in your browser (modern browsers only).
Implementation details
Each of the visualisations was coded in JavaScript to run in a web browser. D3's force-directed layout was used to visualise the network.